This is my last update for the on the sockeye run for this year. Even though fish are still showing up, it is the tail end of all three main sockeye runs in Washington State currently – Columbia River, Lake Washington and Baker Lake.
This article summarizes the data we currently have available in late-July 2019, the 29th to be exact. Some of the data sources are fairly automated and updated quickly. Others take several days to update with new data.
Columbia River
The Columbia River run has fish destined for two locations – up the Okanogan River and into Canada, and up the Wenatchee river to Lake Wenatchee. The combined forecast is roughly 92k, with the majority – about 74k – heading forecasted to head up the Okanogan. Since the Wenatchee fish show up a little bit later, most of the ones which have arrived are the Okanogan fish. The Lake Wenatchee forecast is about 18k.
Currently there are roughly 62k sockeye that have gone over Bonneville Dam in the lower Columbia. This makes the Columbia run currently larger than the other two runs combined.
While that sounds like a lot, this is significantly behind the historical averages for the same day of the year. The 5 year average is 348k and 10 year average is 319k fish. Around this time typically over 99% of the fish have reached Bonneville Dam, which means the run is effectively over.
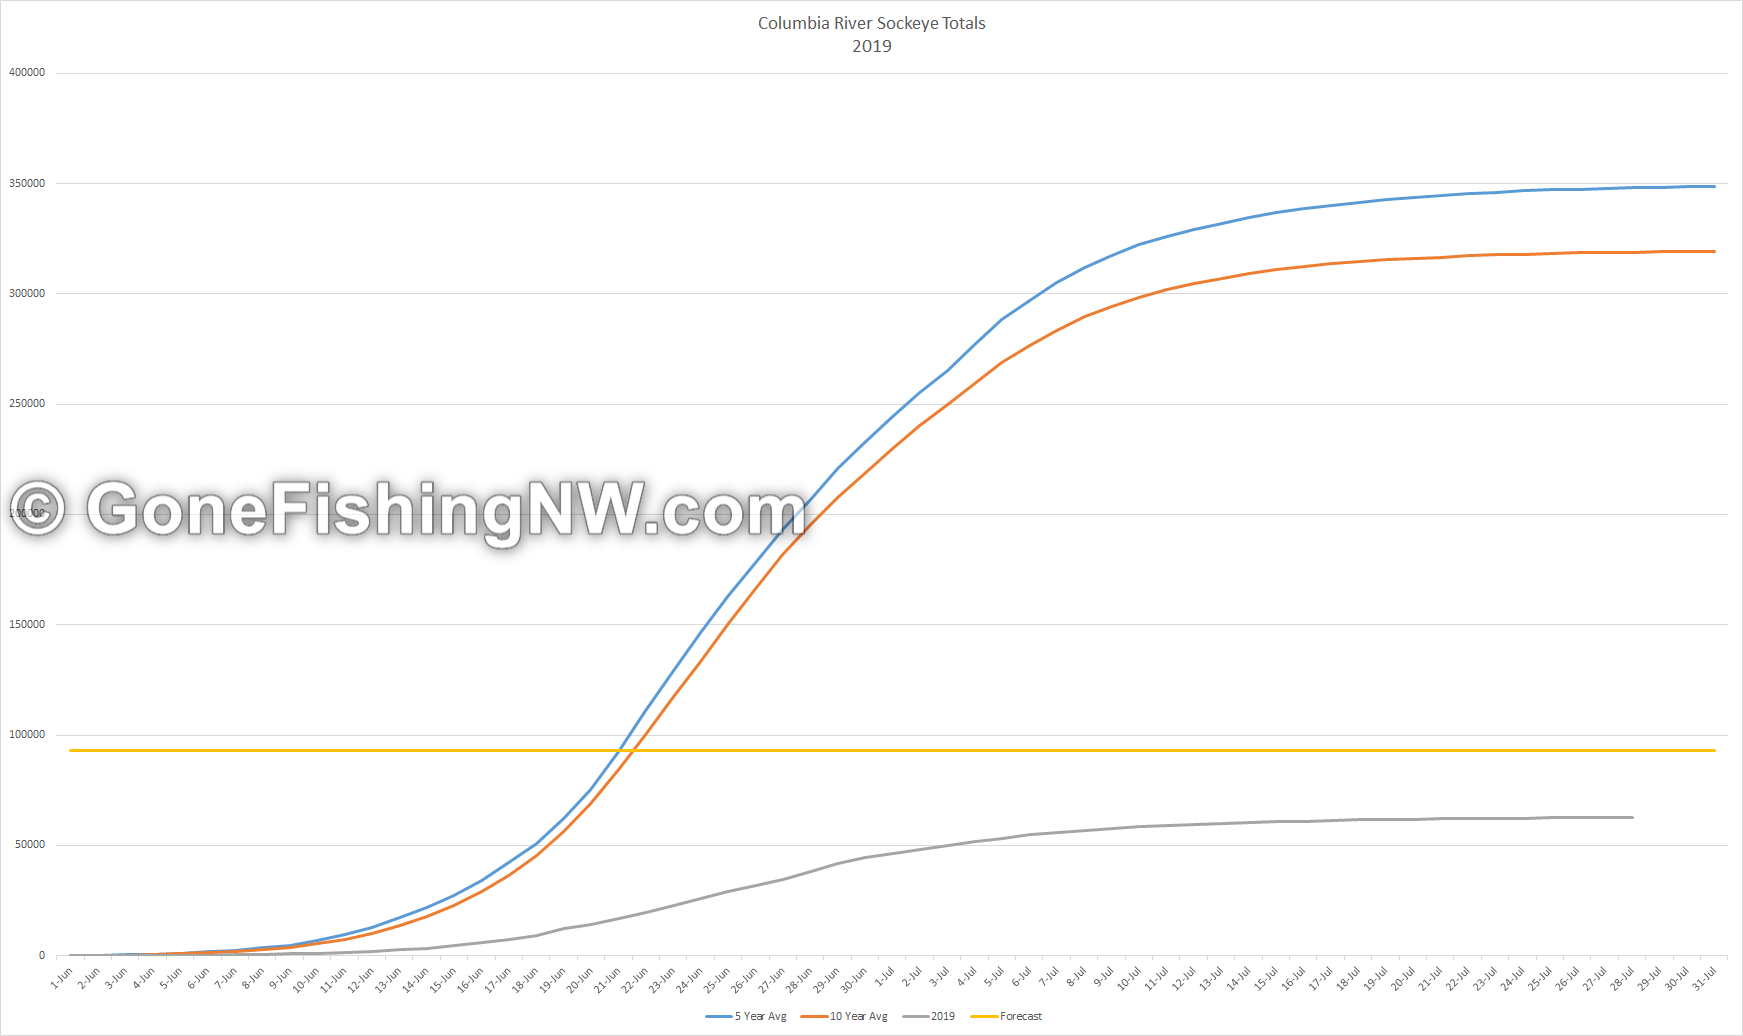
In early July I estimated the complete run would end up around 65k fish – significantly lower than the 92k forecasted. Turns out my estimate was a bit optimistic, as the run is finishing up a few thousand below that.
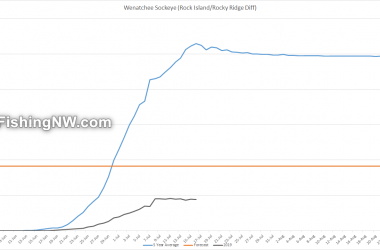
Counts for Lake Wenatchee have been stable for a while. Since counts for Tumwater Dam often lag behind, we can compute an approximation by looking at how many fish have crossed the Rocky Ridge and Rock Island dams – the dams immediately above and below the mouth of the Wenatchee River. By determining the difference, we have a good idea of how many fish might have made the turn to Lake Wenatchee. Right now that difference is about 8400, which is only half the estimate of 18k. The Tumwater dam counts were updated on the 26th, and is about 8800 fish.
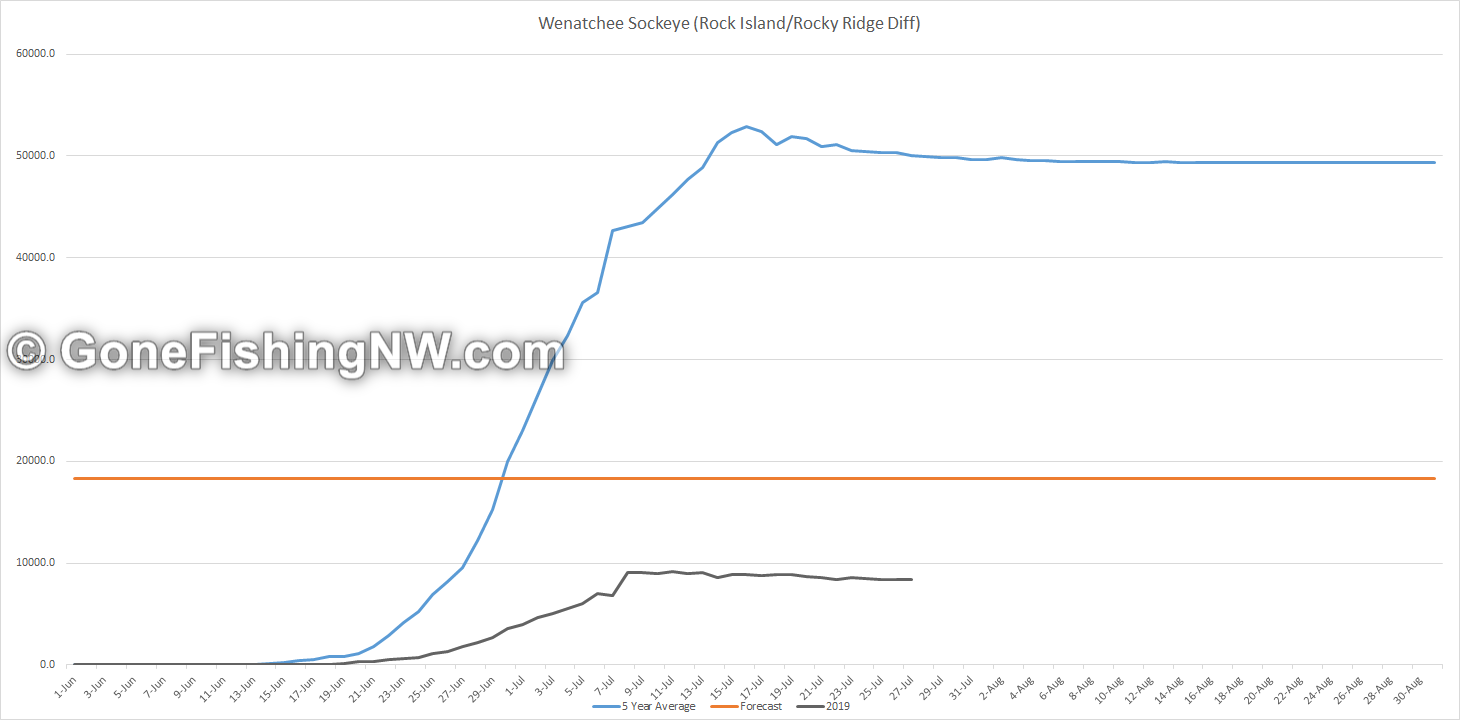
You might be wondering how the Tumwater counts can be higher than counts of the downstream dams. The reason is because the fish counting has a margin of error. The counting is a manual process, and fish might be missed, or counted twice, etc… As well in some sites where the counting is done live, the counters get an occasional break. During that time the data is mathematically extrapolated to fill the hole. As long as the difference is in the hundreds, not thousands, we have a reasonable margin of error.
Lake Washington
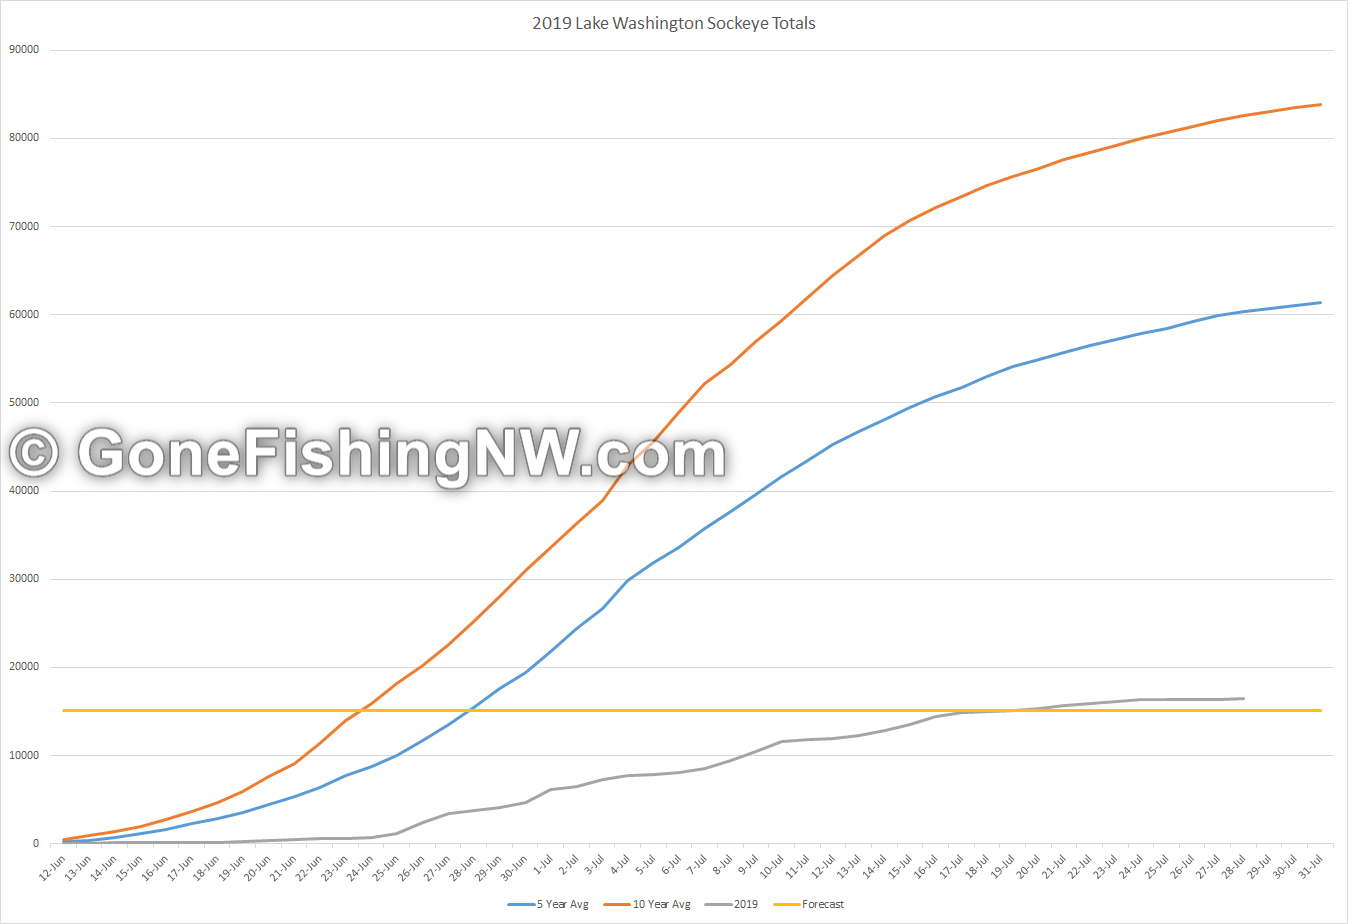
The Lake Washington fish are primarily headed for the hatchery on the Cedar River, but there is a small amount that naturally spawns in both Lake Washington and Lake Sammamish and their associated tributaries. The forecast this year is a dismal 15k, which is about 20 times smaller than needed to meet the escapement goal for a fishery.
Currently over 16k fish have shown up. Historically by this date about 98% the fish have arrived, which means this run is done. It is good the run came in above forecasts, but the forecast was so low, maybe that wasn’t hard to do.
Baker Lake
Baker Lake is a very popular fishery, and is often referred to as “Boat Combat Fishing at its Finest.” It is unique compared to the other runs in that tribal netting largely happens first, then the remaining fish reach a trap and then trucked into the lake for the majority of recreational fishing.
How this works is that the pre-season estimate of about 33k is divided into 3 sets. The first set is the hatchery goal, which is 9k. That leaves roughly 24k, which get split 50/50 between the tribal netting and recreational fishing – for about 12k each.
The tribal netting occurs a little bit in salt water near the mouth of the Skagit River, and the majority in the Skagit and Baker Rivers. It mostly happens at the beginning of the run.
The fish that make it past the nets reach the barrier dam, and fish trap. Once trapped the hatchery gets “first choice” of the fish in the trap, until the weekly hatchery goal is met. This week (July 29 – August 4) the hatchery goal is 724 fish, for a running total of 8543. Any fish left after the hatchery meets its weekly quota are then trucked to the lake.
If you’d like to know more about the process, then check out Baker Lake Sockeye By The Numbers.
For the past two weeks the number of fish reaching the trap hasn’t been enough to meet the hatchery quota. This means two things. First, no new fish have been put in the lake since July 14th. Second, it means that hatchery has to catch up before any new fish go to the lake, and since it is 900 fish behind it seems unlikely.
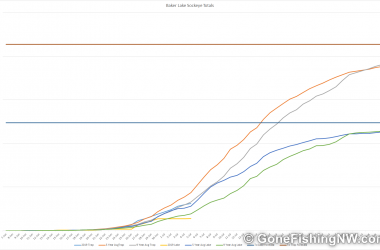
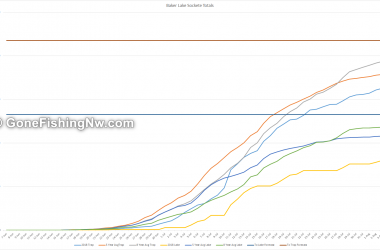
Currently about 12k fish have reached the trap, which is down from historical numbers for this date – the 5 year average is 18k fish and 9 year average is over 17k fish. Out of those 12k fish, 4300 have been trucked to the lake vs the 5 year average of 11k and 9 year average of 11k fish.
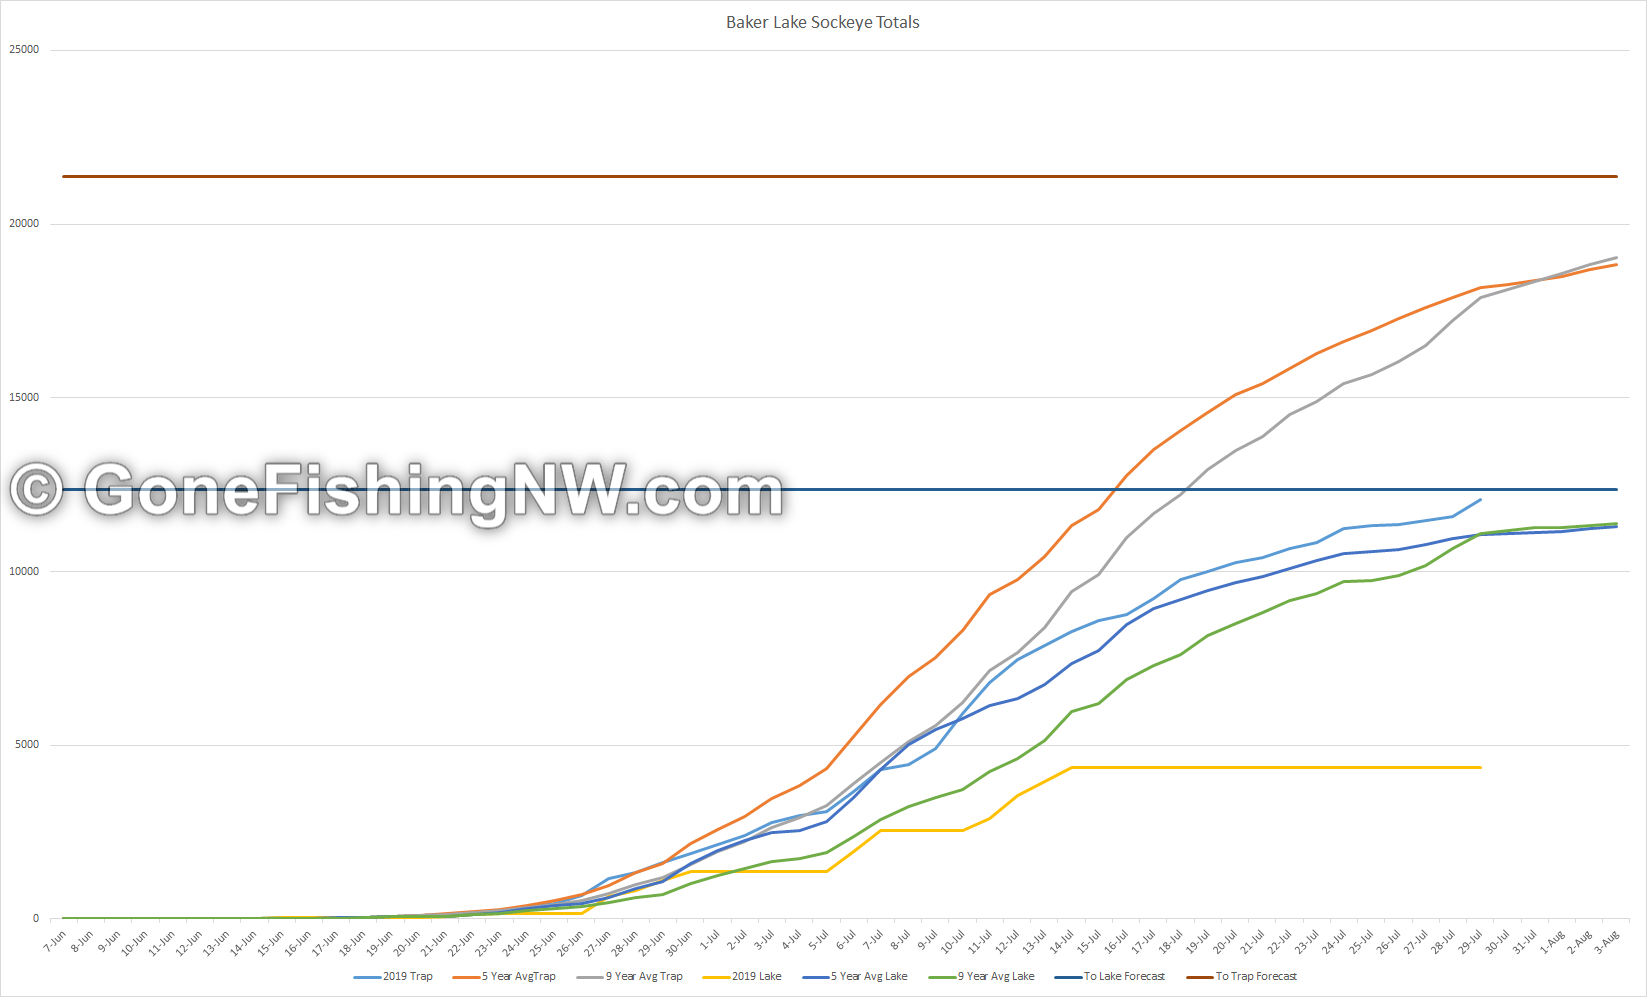
Usually at this point roughly 96% of the fish of the total run have made it back. In early July I predicted that only 14k fish would reach the trap and 5k in the lake. Now that we have more data, I’m disappointed to say that prediction seems overly optimistic.
Generally speaking the reports I’ve seen have been disappointing, which isn’t surprising given the low numbers.
Resources
If you want to improve your sockeye fishing game, then make sure to take some time to read about gear and techniques in this guide about sockeye fishing.
If you want to track the numbers for these different runs yourself, then you can find that information at:
Good luck and Tight Lines!