Baker Lake is a beautiful and popular fishery. However recent years have been frustrating for many people when large pre-season estimates don’t reflect the reality of fish available in the lake to fish for. I wanted to have a fact based approach to understanding what is going on with this fishery. What follows is the information I’ve gathered, hard data about fish harvest and my reasoned analysis.
I freely admit that I’m a recreational fisherman and have a natural bias towards that. In this article I try to put that aside and stick to the facts and unbiased and reasonable analysis of those facts.
History
Sockeye, unlike other salmon species, live for a year in a freshwater lake, before migrating out to the ocean – which is why you only find them in river systems which have an accessible lake. To learn more about sockeye and how to catch then please review The Best Guide To Fish For Sockeye In Lakes.
Baker Lake, located in northern Washington state, is home to a genetically distinct strain of sockeye. Originally Baker Lake was a decent size natural lake and had a natural, if not very numerous, run of sockeye. It is estimated the run was typically around 20,000 fish. Out of the lake flows the Baker river, which is a tributary of the Skagit river.
A hatchery was constructed in 1896 to increase the size of the run.
In 1925 the Lower Baker River dam was constructed on the river – forming Shannon Lake. Later, in 1959 the Upper Baker Lake dam was finished, significantly enlarging the size of Baker Lake. Between these two dams migratory fish access was blocked.
In 1957 artificial spawning beaches were constructed near the hatchery to further increase production of sockeye.
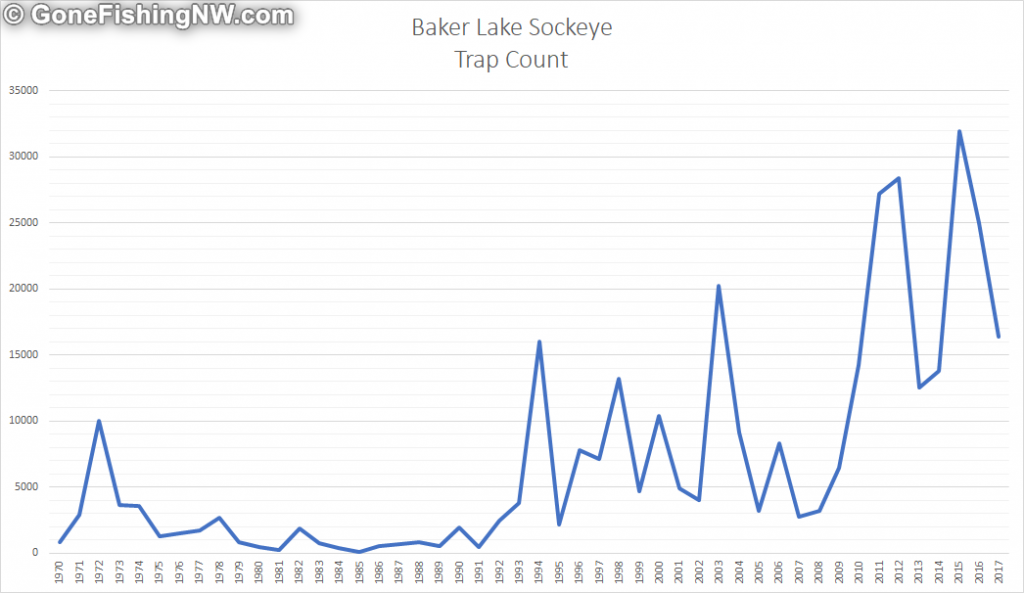
Puget Sound Energy, which operates the dams, provided some mitigations for the salmon – these resulted in minimal success, with often less than 1000 fish making it back to spawn. In 1985 the return hit a low point with only 99 fish returning.
This triggered more efforts to increase the number of fish. As you can see in the graph there is an upward trend in the number of fish returning.
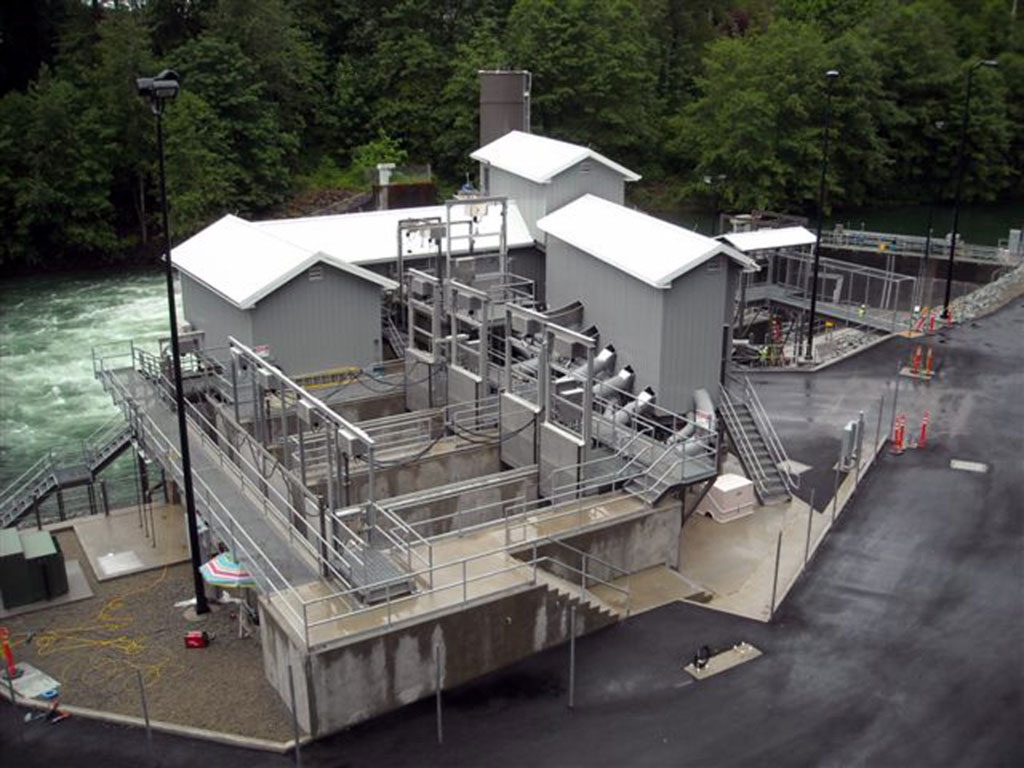
The major contributors to the increase are the Floating Surface Collector (completed in 2008 for Baker Lake and 2013 for Lake Shannon), improved hatchery facilities (completed in 2010) and improved fish trap (completed in 2010). These greatly increase the number of fry which are born, and the number of smolt which make it past the dams into the river. If you have some time I highly suggest watching the videos PSE made about the Floating Collector and Fish Trap.
These efforts have created a large enough run that starting in 2010 there has been recreational fishing season for sockeye, as well as tribal harvest.
How Baker Lake Fish Are Allocated
There are multiple demands on these returning sockeye – supporting the next generation via hatchery efforts and natural spawning, recreational fishing and tribal harvest. Understanding how all these interests intersect can sometimes be complex and hard to understand. However with the Baker Lake system we have a unique opportunity – due to the fish trap – to have fairly complete data about where the fish wind up.
At the North of Falcon meeting the estimated return number is presented and first they take out the “overhead”. That overhead includes:
- Broodstock for the hatchery (about 4000-5500 fish)
- Based on 2010-2017 actual data. Generally speaking the more recent years take more broodstock than earlier years – perhaps indicating a ramp up in hatchery production
- Broodstock for the artificial spawning beaches (about 2200 fish)
- This is based on 2010-2017 actual data. Since 2013 the number of fish taken has been very close to 2200.
- Fish taken to the lake for natural spawning (1500 fish)
- This is based on information in a slide deck the WDFW presented on Baker Lake sockeye on January 31, 2015 and have available on their site.
- Fish taken in test netting operations (average 350 fish)
- This is based off actual 2010-2017 data of fish netted in test fisheries.
- Fish mortality which occurs as a side effect of the fish trapping and transportation operation (average 40 fish)
- This is based off actual 2010-2017 data, excluding 2011 where equipment issues causes a morality of over 900 fish.
If we combine all that, then since 2010 the overhead averages out to almost 8200 fish per year.
That overhead is then subtracted out from the estimate. Then the remainder is split in half – 50% for tribal harvest and 50% for recreational fishing.
So if we apply this formula to 2018’s forecast of 35,000 fish then the breakdown should be something close to this:
| Overhead | 8,200 |
| Tribal Harvest Share | 13,400 |
| Recreational Share | 13,400 |
| Total | 35,000 |
Of course, as we know, estimating the number of returning fish can be hard and is more art than science. This brings in the first challenge with how the fish are divided up – it is based on a number which can be very inaccurate.
Ocean Harvest and Fishing In Practice
Now that we know how the fish are allocated in theory at the North of Falcon meeting, the next step is to examine how fishing and harvesting actually occur in practice during the season.
There are basically 4 places where these events occur:
- The ocean
- The Skagit and Baker rivers
- The fish trap
- Baker Lake
The Ocean and Skagit Bay
Sockeye can be caught in the ocean by both recreational fishermen and by tribal netting.
The recreational catch is not significant. From 2010-2017 for all of Washington state an average of 200 sockeye were reported as caught in saltwater. Some of these fish were doubtlessly bound for other terminal areas – such as Lake Washington. However, with the catch being so low I didn’t think it useful to attempt to make a guess on how to separate them.
I don’t know why the numbers are so low, my guess is that it is likely due to a combination of regulations limiting when/where ocean anglers can target sockeye and relatively low amount of angler effort for saltwater sockeye. In fact I’d be willing to bet than many of the sockeye which are caught were actually bycatch while targeting other salmon species.
For tribal harvest I have limited data as to where all the netting occurs and how many fish tend to be caught at the different places – but based on 2017 the tribes harvest about 20% of their catch in Skagit Bay.
Skagit and Baker Rivers
For those fish which make it into freshwater they face both recreational anglers and tribal netting.
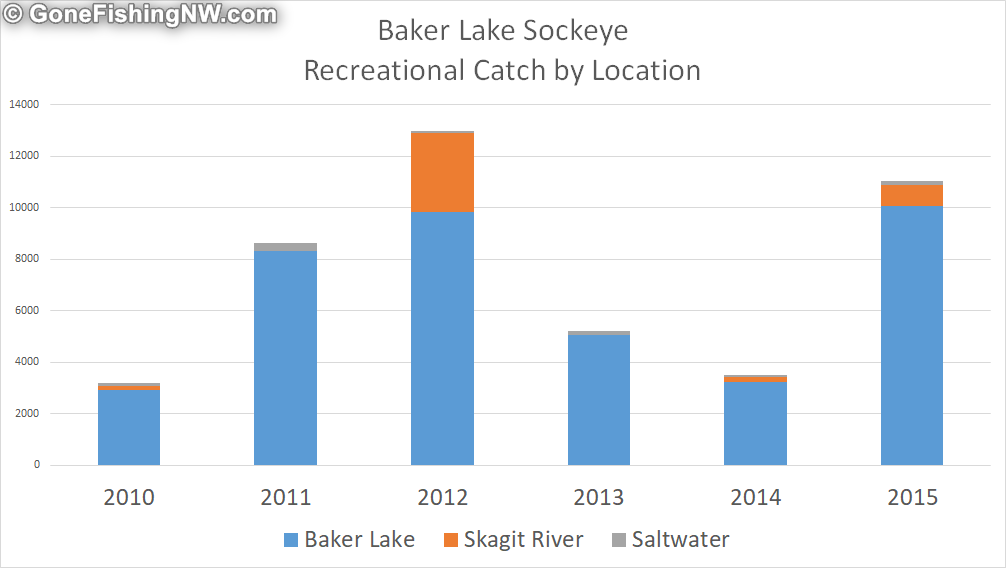
For 2010-2015 the recreational catch averaged around 700 fish caught in the river. However, 2012 is a clear outlier in the data. That year about 3000 fish were caught by recreational anglers in the river. If we factor that away then the average falls to about 200 fish caught in the rivers each year. I don’t know why 2012 is so different – it is so different that I wonder if there isn’t an error of some kind in the WDFW’s data.
In any case that data shows that the recreational catch in the rivers – while greater than saltwater – is not very significant.
For tribal harvest we know that the majority happens in the river, since it is the only place they net other than the ocean – where they take about 20% of their catch. Based on 2017’s data about 80% of tribal harvest occurs in the river. The breakdown of total harvest for sections of the river are:
| Lower Skagit River | 32% |
| Upper Skagit River | 10% |
| Baker River | 37% |
Fish Trap
After making it up the Baker River the fish next encounter the barrier dam and the fish trap. Once in the fish trap they are sorted and then loaded into trucks. The trucks then take the fish to various places:
- Hatchery
- Artificial spawning beaches
- The tribes
- Baker Lake (both for natural spawning and recreational fishing)
And of course, some fish die during processing at the fish trap, resulting in the mortality overhead.
The hatchery and artificial spawning beaches have the top priority for these fish. The hatchery/beaches have a weekly goal for how many fish they need. Starting on Monday they get all the fish showing up that week until the goal is met. If, for some reason, the previous week’s goal was not met (it has happened) then they keep getting fish allocated to them until they are caught up. The quota goal is bell curve shaped – trying to match the natural distribution of the run. So early and late in the run the weekly quota is low, but in the middle of the run it is quite significant.
After the weekly quota is met, I assume the next priority is the tribal take. This averages about 2000 fish per year – although the last two years no fish were allocated to the tribes from the trap. I have no insight into how the decision is made on how many fish to give to the tribe from the trap.
And fish remaining get trucked up to Baker Lake for natural spawning and recreational fishing.
Baker Lake
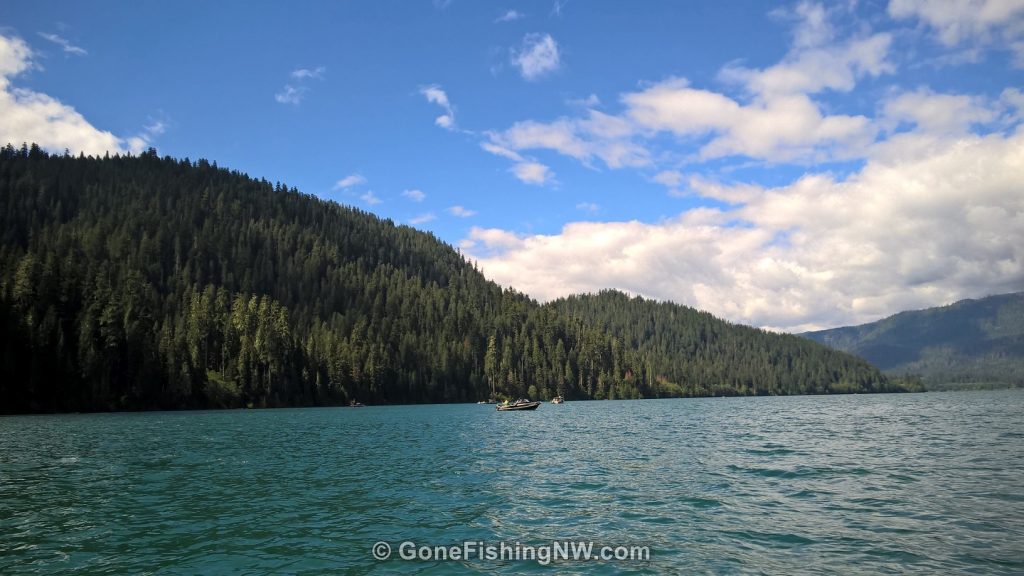
Lastly once the fish are in Baker Lake they are heavily targeted by recreational anglers. Based on historical data about 6500 fish are caught by recreational anglers each year in the lake. This is about 90% of the total recreational catch for this run of sockeye.
Analysis of Harvest and Fishing
The data shows clearly that the tribes catch the vast majority of all sockeye caught in the ocean and rivers. Then the hatchery gets its share of the fish. Lastly the recreational anglers get their primary opportunity to target these fish.
Acquiring and Processing Data
By now you might be wondering how I got all this data, and how I processed it. I’ll go over each set of data for you.
Allocation Strategies
The WDFW gave two presentations about Baker Lake sockeye and shared the slide decks online. These cover, among other things, how the allocations are divided.
One thing to note in those slide decks is the tables which show tribal take for the various years only account for fish taken while netting. They do not include fish allocated to the tribe from the fish trap. This makes a significant difference, as you’ll notice when the yearly totals are presented below.
The same web page also provides the historical fish trap totals.
Recreational Catch Data
The WDFW website also provides the summary data for the Catch Record Cards that everyone is supposed to update and turn in. As of the time of writing this article the latest year available was 2015.
This data is broken down by area, species and month.
Like any data produced by people we know there are going to be inaccuracies – fish mis-recorded, CRCs not turned in, records hard to read, data entry errors, and so on. I’m making the assumption that any inaccuracies are accidental and that generally the data is complete and reasonably accurate.
Tribal Netting Data
For tribal netting data I submitted a Freedom of Information request to the WDFW asking for the tribal reported catch for 2010-2017.
The data lists the date that netting occurred, how many fish were caught and what type of netting it was. The types of netting are:
- Test
- Ceremonial/Subsistence
- Take Home
- Commercial
Test netting is done with the intent to determine where fish are and how many may be in an area. This is counted as part of the overhead because the data is shared with the WDFW.
Ceremonial/Subsistence netting should be pretty obvious in meaning. These count against the tribal share.
Take Home netting are fish the fisherman takes home with him for his own purposes – but is not intended for sale. This may be to fill his freezer, share with family or friends, and so forth. These count against the tribal share.
Commercial netting is for profit purposes. These fish are intended for sale, I imagine usually through a middle man to restaurants and so forth. These count against the tribal share.
I’ve made the raw data from the WDFW available. As you look at it please be aware that some dates have multiple entries. This is either due to different types of netting, or perhaps multiple groups of netters operating on the same day.
Like the catch record card data I’m making the assumption that any inaccuracies are accidental and that generally the data is complete and reasonably accurate.
Fish Trap Data
The fish trap data I received by doing a Freedom of Information request to the WDFW for 2010-2017 asking for the number and dates of fish trapped, and how they were distributed.
The spreadsheets are mostly self-explanatory.
I’ve made the raw data from the WDFW available below.
Please note that while I examined this data I did find mistakes in some of the formulas resulting in totals being incorrect. I dealt with this by importing all the raw daily data into my own spreadsheet and adding correct formulas. I compared my results with the originals from the WDFW and where they differed I investigated until I found the source of the difference, then updated as necessary.
- Baker Adult trap 2010-2011
- Baker Adult trap 2011-2012
- Baker Adult trap 2012-2013
- Baker Adult trap 2013-2014
- Baker Adult Trap 2014-2015
- Baker Adult Trap 2015-2016
- Baker Adult Trap 2016-2017
- Baker Adult trap 2017-2018
Like the catch record card data I’m making the assumption that any inaccuracies are accidental and that generally the data is complete and reasonably accurate.
Yearly Summaries
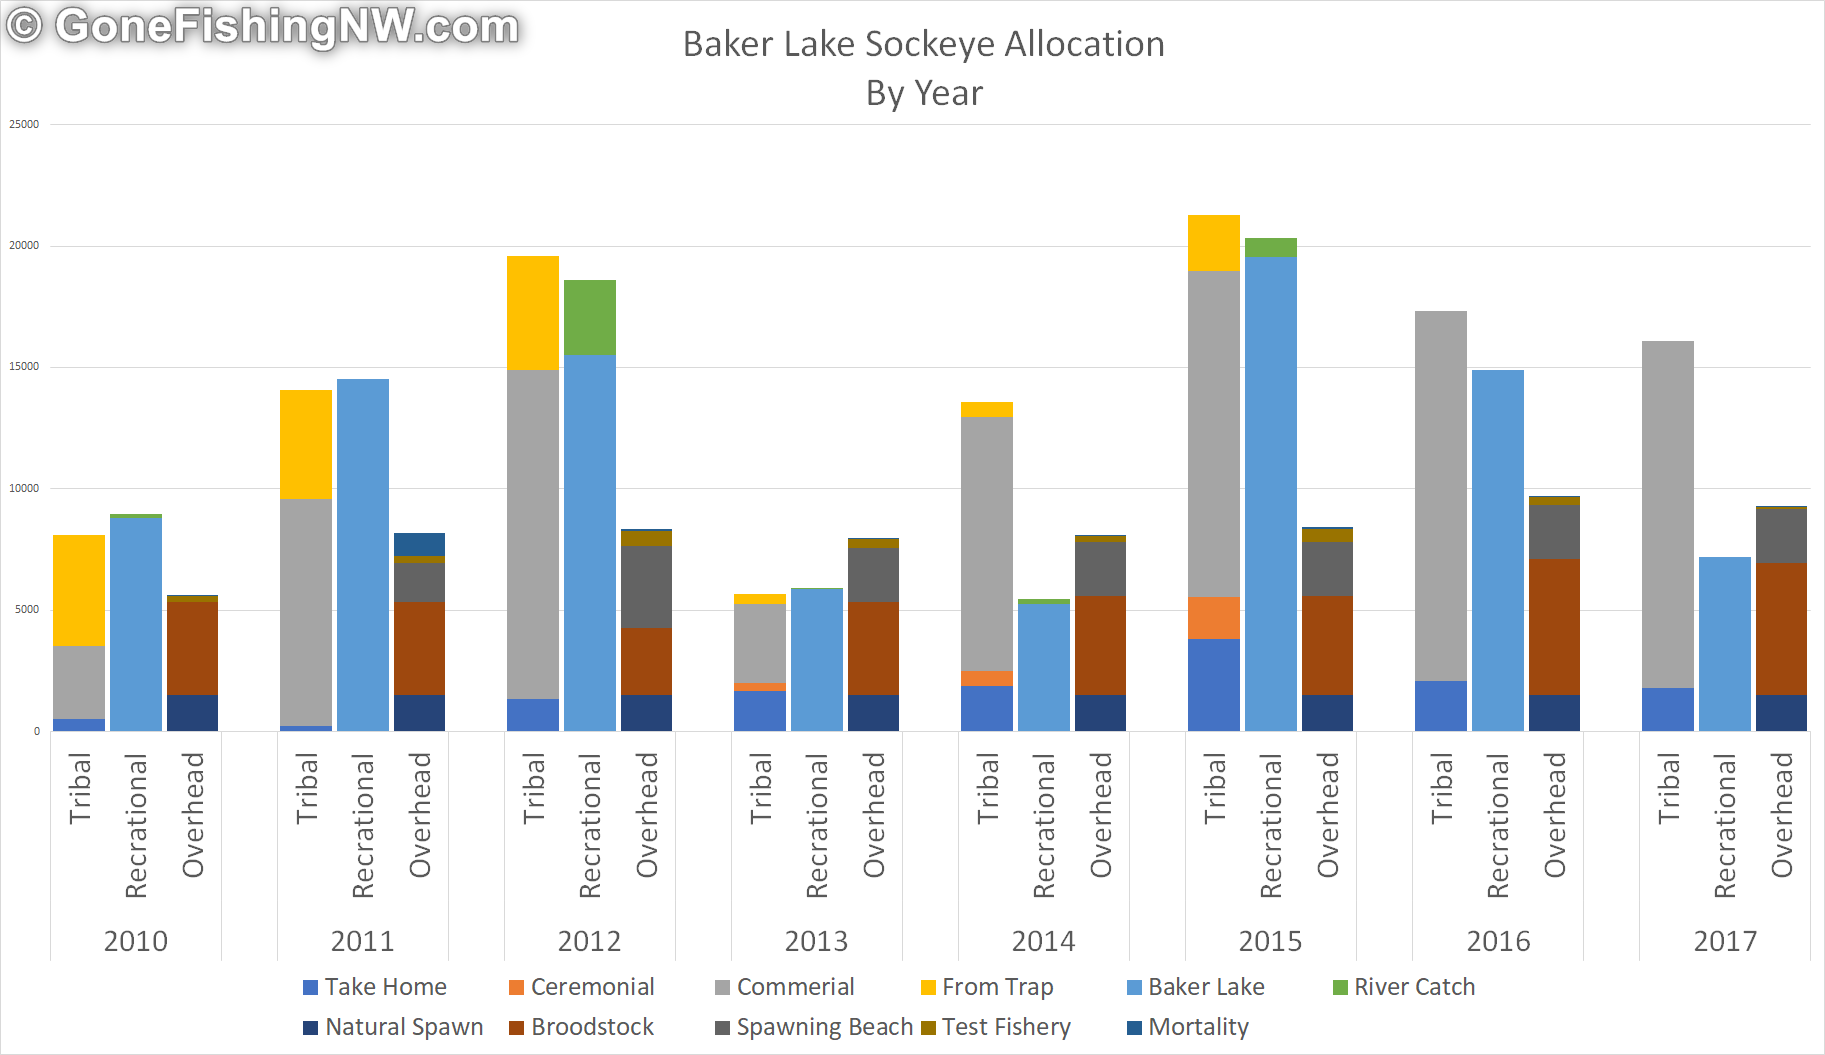
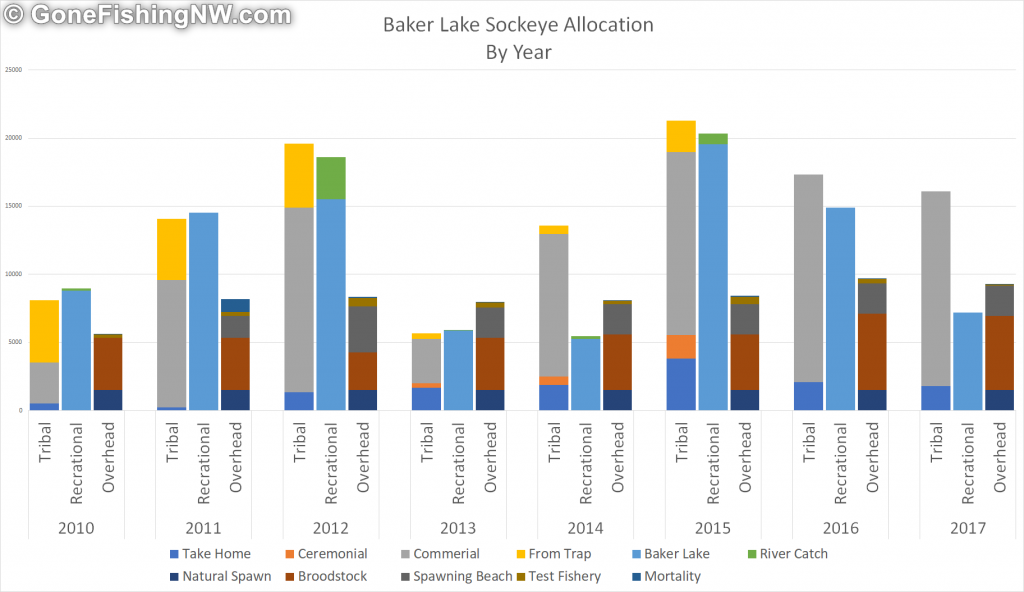
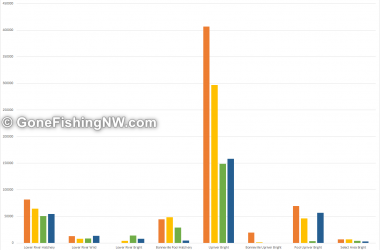
Now I can present the overall results. Below is a graph which for each year shows the breakdown of tribal harvest, recreational opportunities and overhead.
Tribal harvest includes:
- Commercial netting
- Take home netting
- Ceremonial/subsistence netting
Recreational opportunity is the number of fish transported to Baker Lake for recreational harvest plus the number of fish reported caught in the river. The 1500 fish in the lake intended for natural spawning is factored out.
Overhead includes:
- Hatchery broodstock
- Artificial spawning beaches
- 1500 for natural spawning in the lake
- Test netting
- Fish trap mortality
Conclusions
The graph shows that most of the years are pretty close to a 50/50 allocation between recreational and tribal harvest. This is probably about close to as realistically possible given the inaccuracies behind the preseason estimates.
However three years stand out as being quite unbalanced – 2014, 2016 and 2017. In those cases the tribal harvest was significantly more than the recreational opportunity.
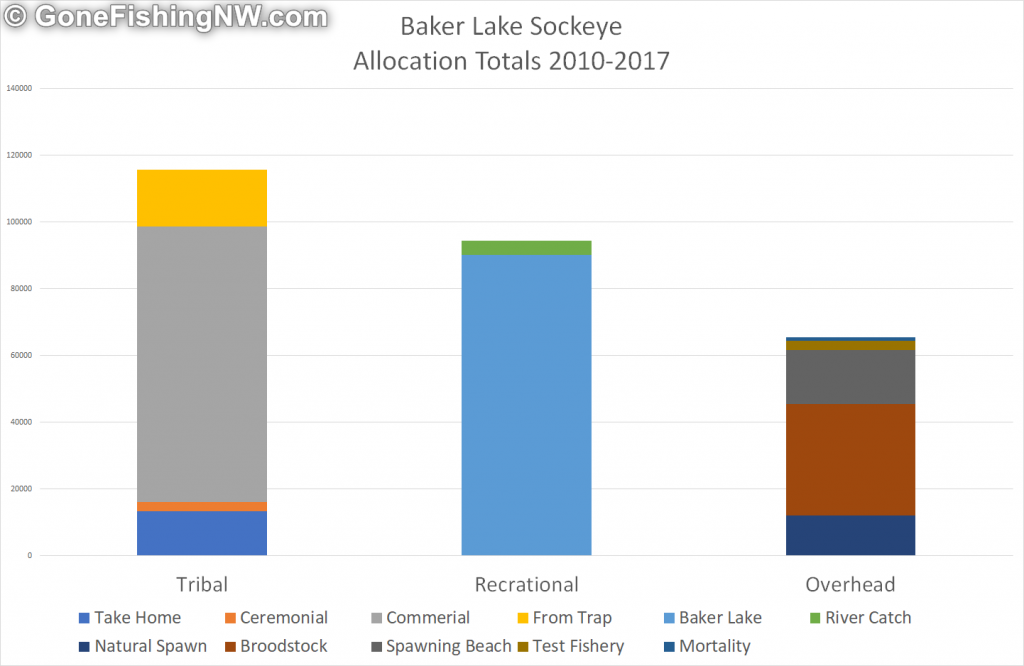
We can see how this unbalanced harvest has added up over the 2010-2017 time period.
In my opinion the problem is due to two main things.
First, that because the tribal harvest occurs in the ocean and rivers before the majority of recreational opportunity in the lake. So if the actual fish return is significantly lower than the estimated forecast, this leaves reduced ability to adjust the allocations – especially since most of the tribal harvest occurs in June and early July.
For example, in 2017 the tribes harvested 97% of their total harvest by July 12th. According to the WDFW presentations previously referenced they need to reach the midpoint of the migration – which is right about July 12th or 13th – in order to accurately update their models.
Second, is there is no obvious accountability to either group going over in their harvest allocation. As Bob Proctor said “Accountability is the glue that ties commitment to the result.”
These two things have led to a consistent imbalance in the reality of fish allocation when we look at the totals from 2010-2017.
I believe changes are need in this system to ensure fairness on both sides when the actual return is either significantly higher or lower than the preseason estimates. Finding a solution will no doubt be hard due to the different constraints and concerns.
Questions
What do you think of this analysis? I’m interested in a dialog about this fishery based in fact and mutual respect. Name calling or disparaging remarks about any party will be deleted.
Don’t forget to check out the page that is all about fishing for sockeye to learn more about sockeye and how to catch lots of them.

Comments are closed.